The Behavior Scorecard
Know how each young person is doing, right now.
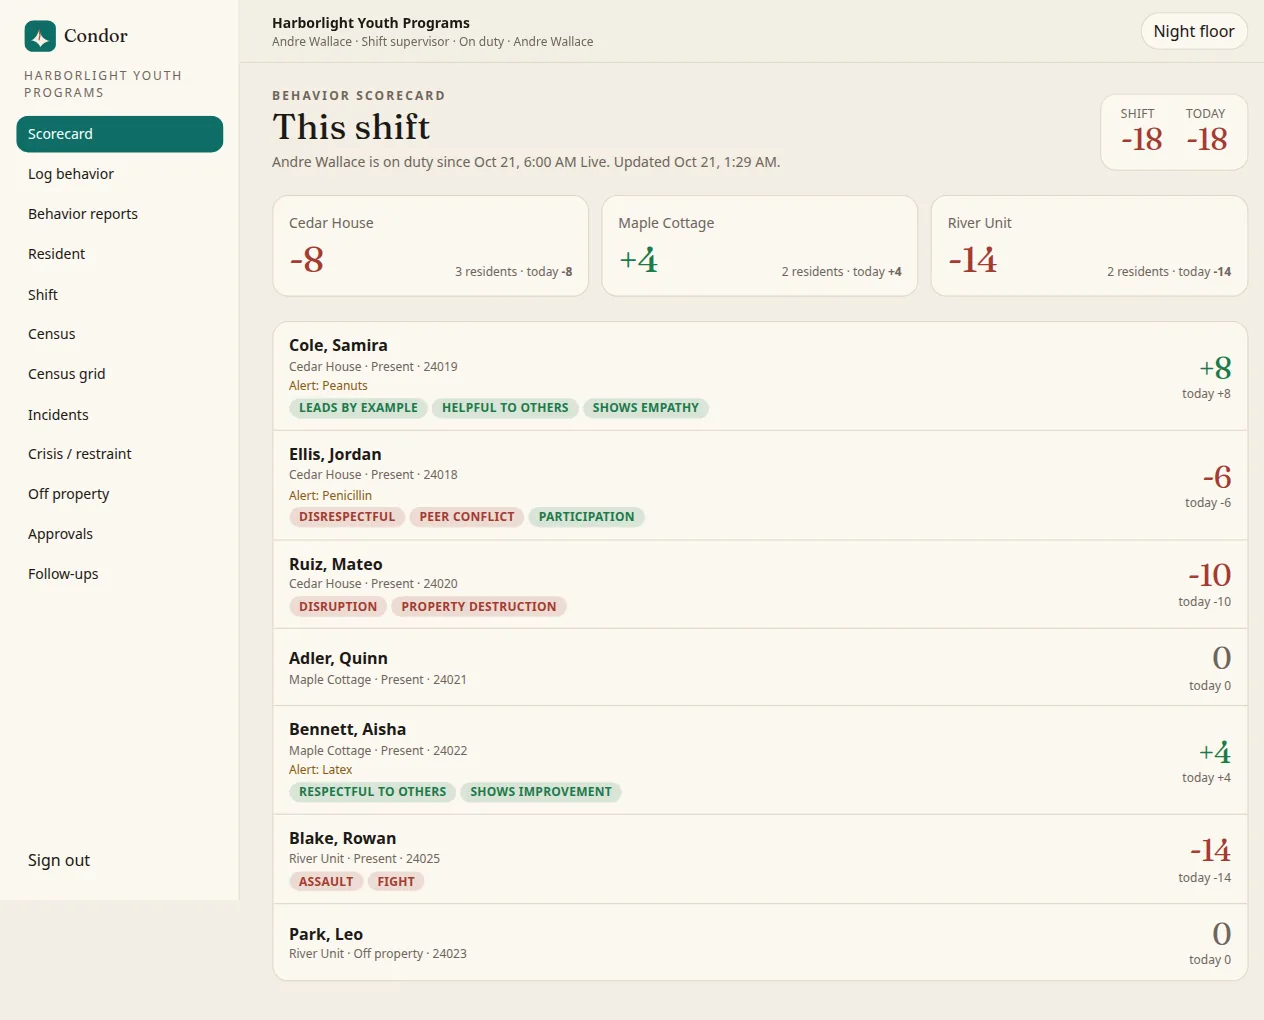
Paper point sheets tell you what happened last week. The Condor Scorecard shows what is happening this shift, and it is built your way.
HIPAA-ready · SOC 2-ready · Screens show sample data only
Your scorecard, your rules
The problem
Every program scores behavior differently. Most software makes you bend to its list, so staff go back to paper.
What Condor does
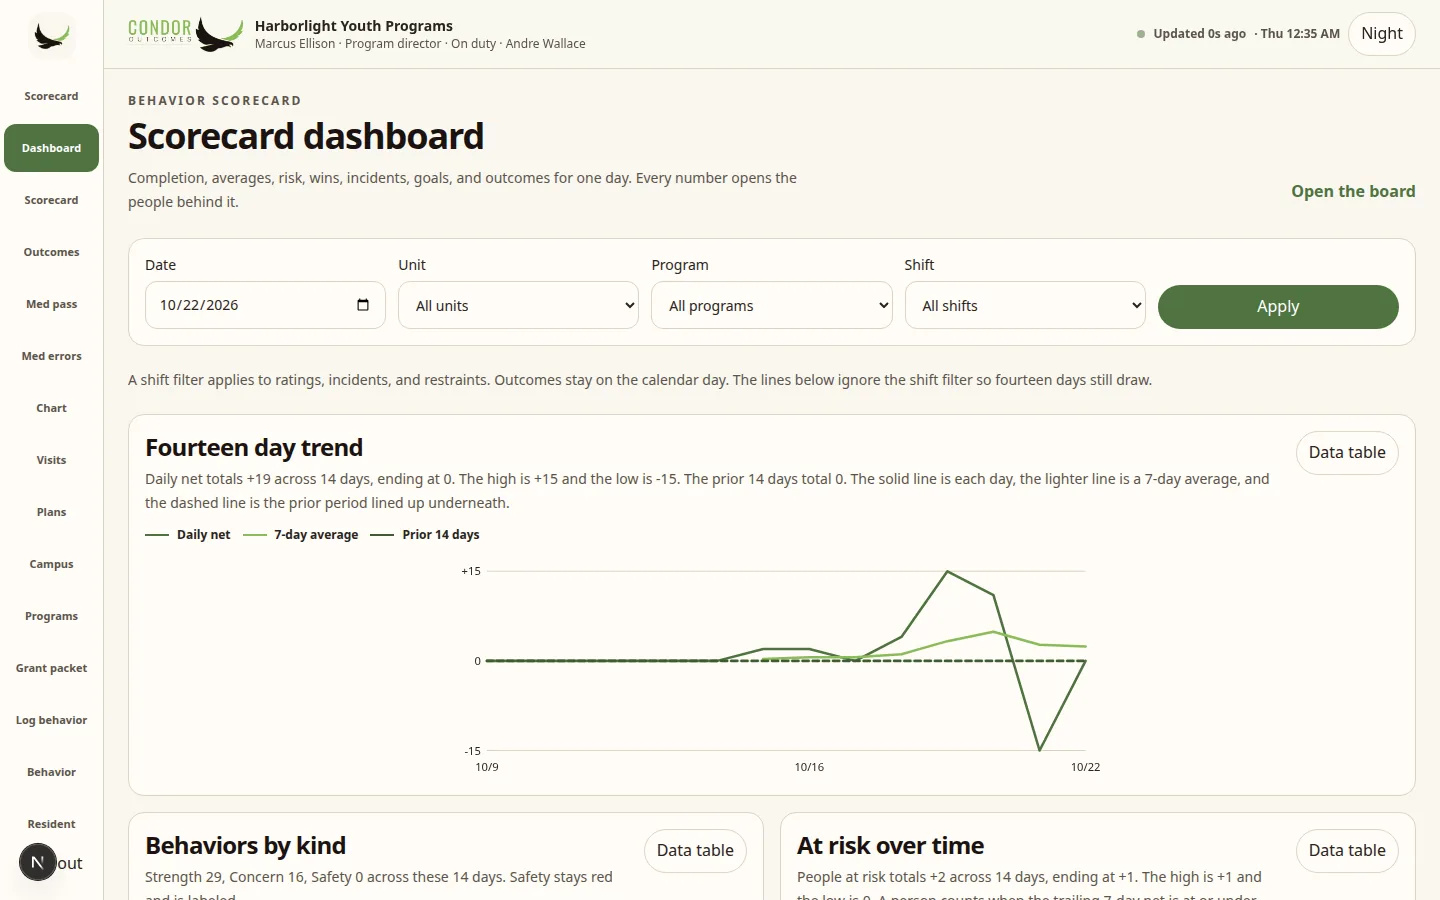
You build the scorecard: behaviors, weights, a rating scale, levels and thresholds. Draft it, then publish. Publishing changes future logs only. Points already stored stay as they were, so history is never rewritten. Copy a template onto another program.
- Templates per program
- Your own behaviors, weights and point values
- Levels and at-risk thresholds
- Template versions publish without rewriting history
Two taps on the floor
The problem
If logging takes more than a few seconds, it does not get done.
What Condor does
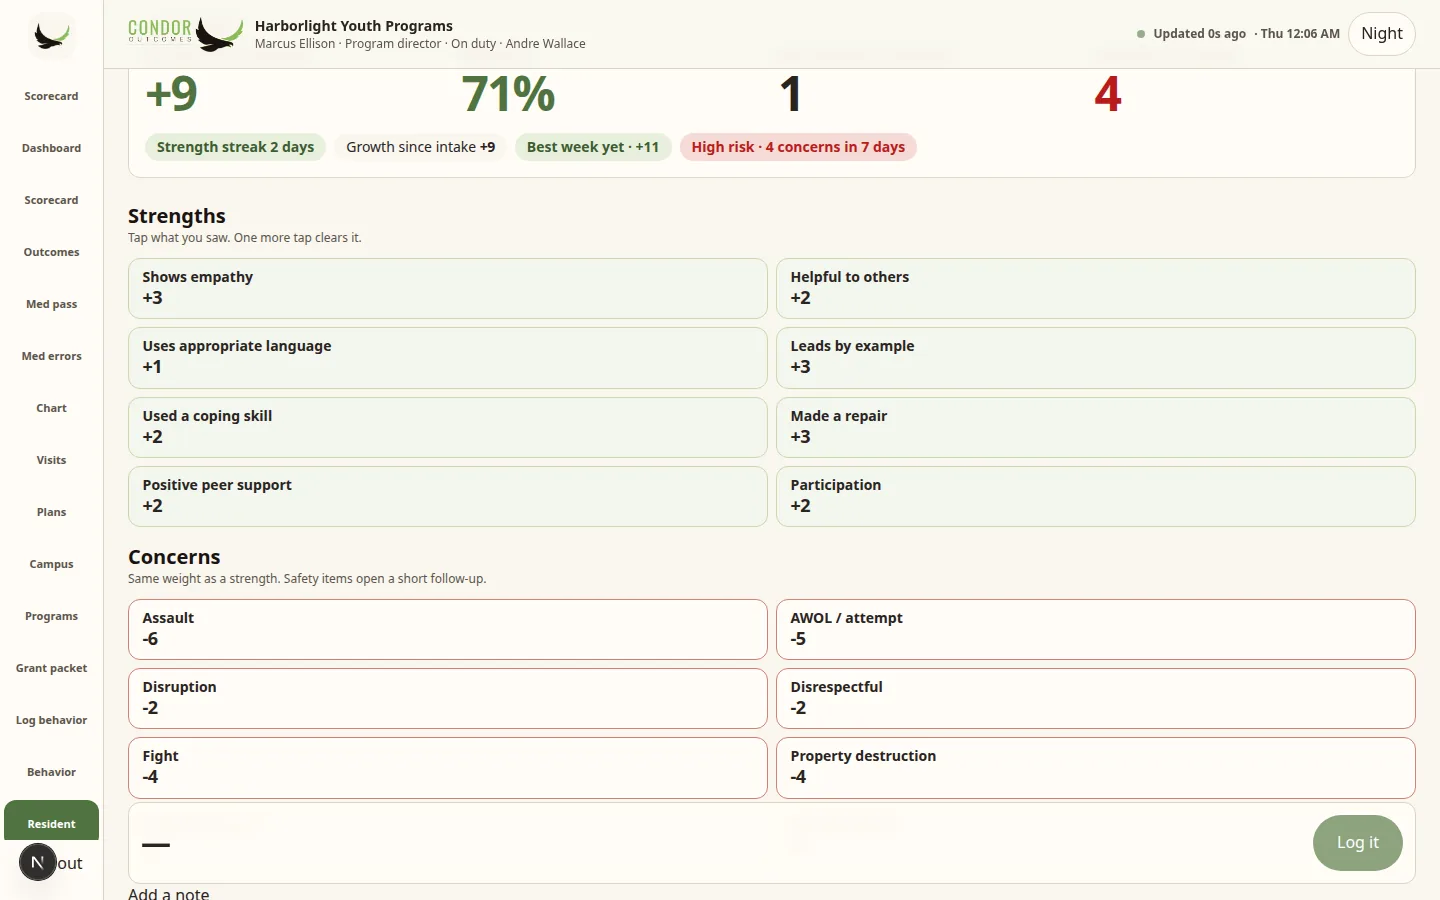
Floor staff see today’s points and log without leaving the board. Tap a rating, then a person. Or give one rating to a whole cottage when the same thing happened for the group. Staff can also stay on one young person’s profile and keep logging.
- Two-tap entry
- One rating for a whole unit
- Quick log on the person’s profile
- The board refreshes about every 8 seconds, so a second device sees new logs
When two taps are not enough
The problem
Some moments need the full story, including safety behaviors.
What Condor does
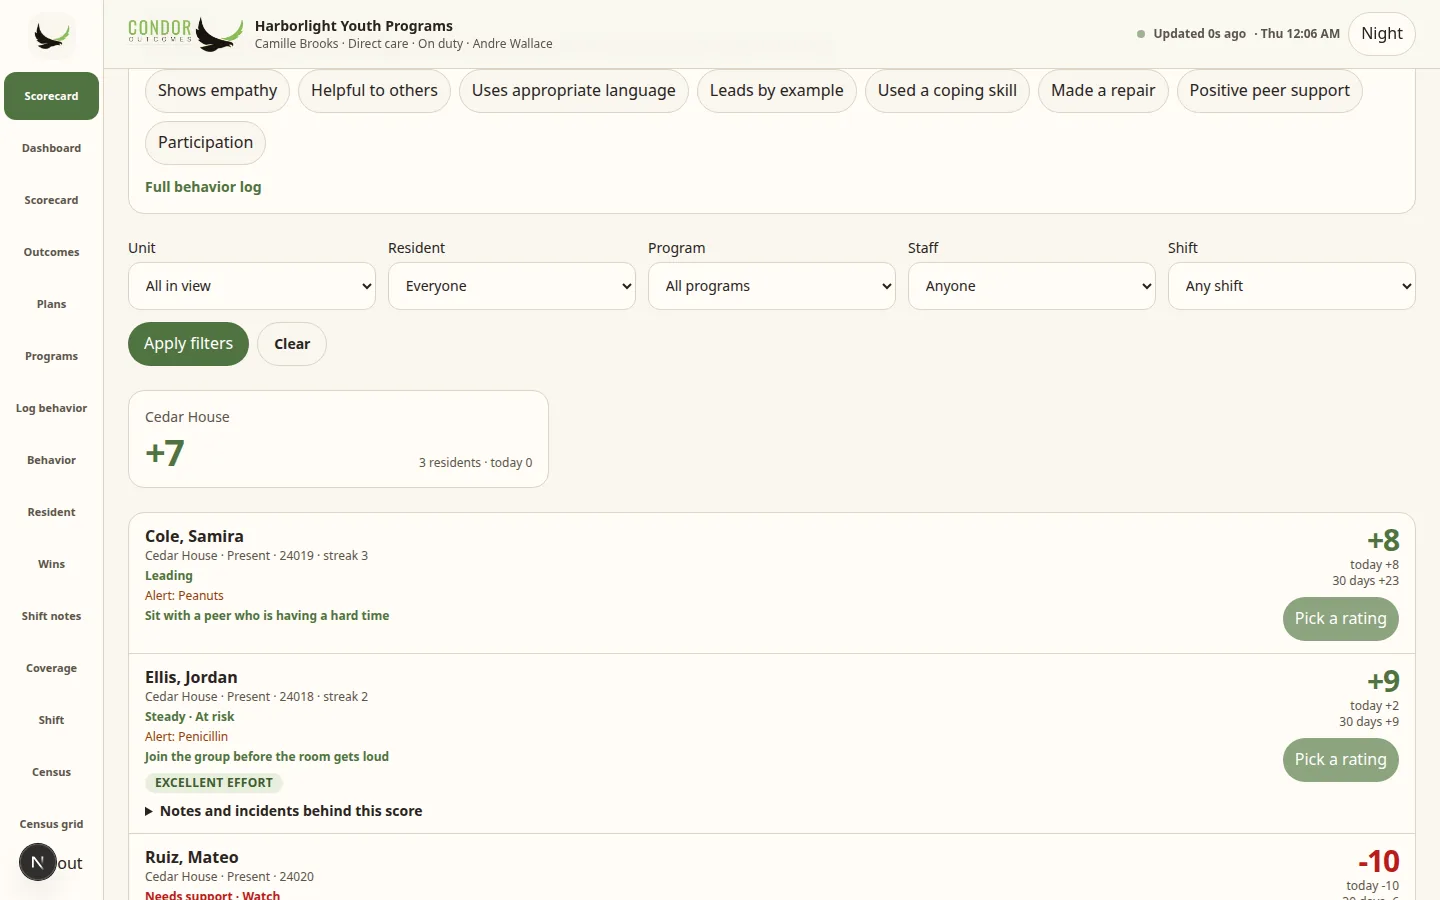
Log what you saw opens a longer form. Supervisors can find the behavior report behind any score, and a supervisor with the right role can void a mistaken entry without erasing the audit trail. It works offline and files when the connection is back.
- Full behavior log
- Behavior reports behind every score
- Void a score, with the trail kept
- Offline queue on the phone
One dashboard, every number clickable
The problem
Directors piece together the day from emails and phone calls.
What Condor does
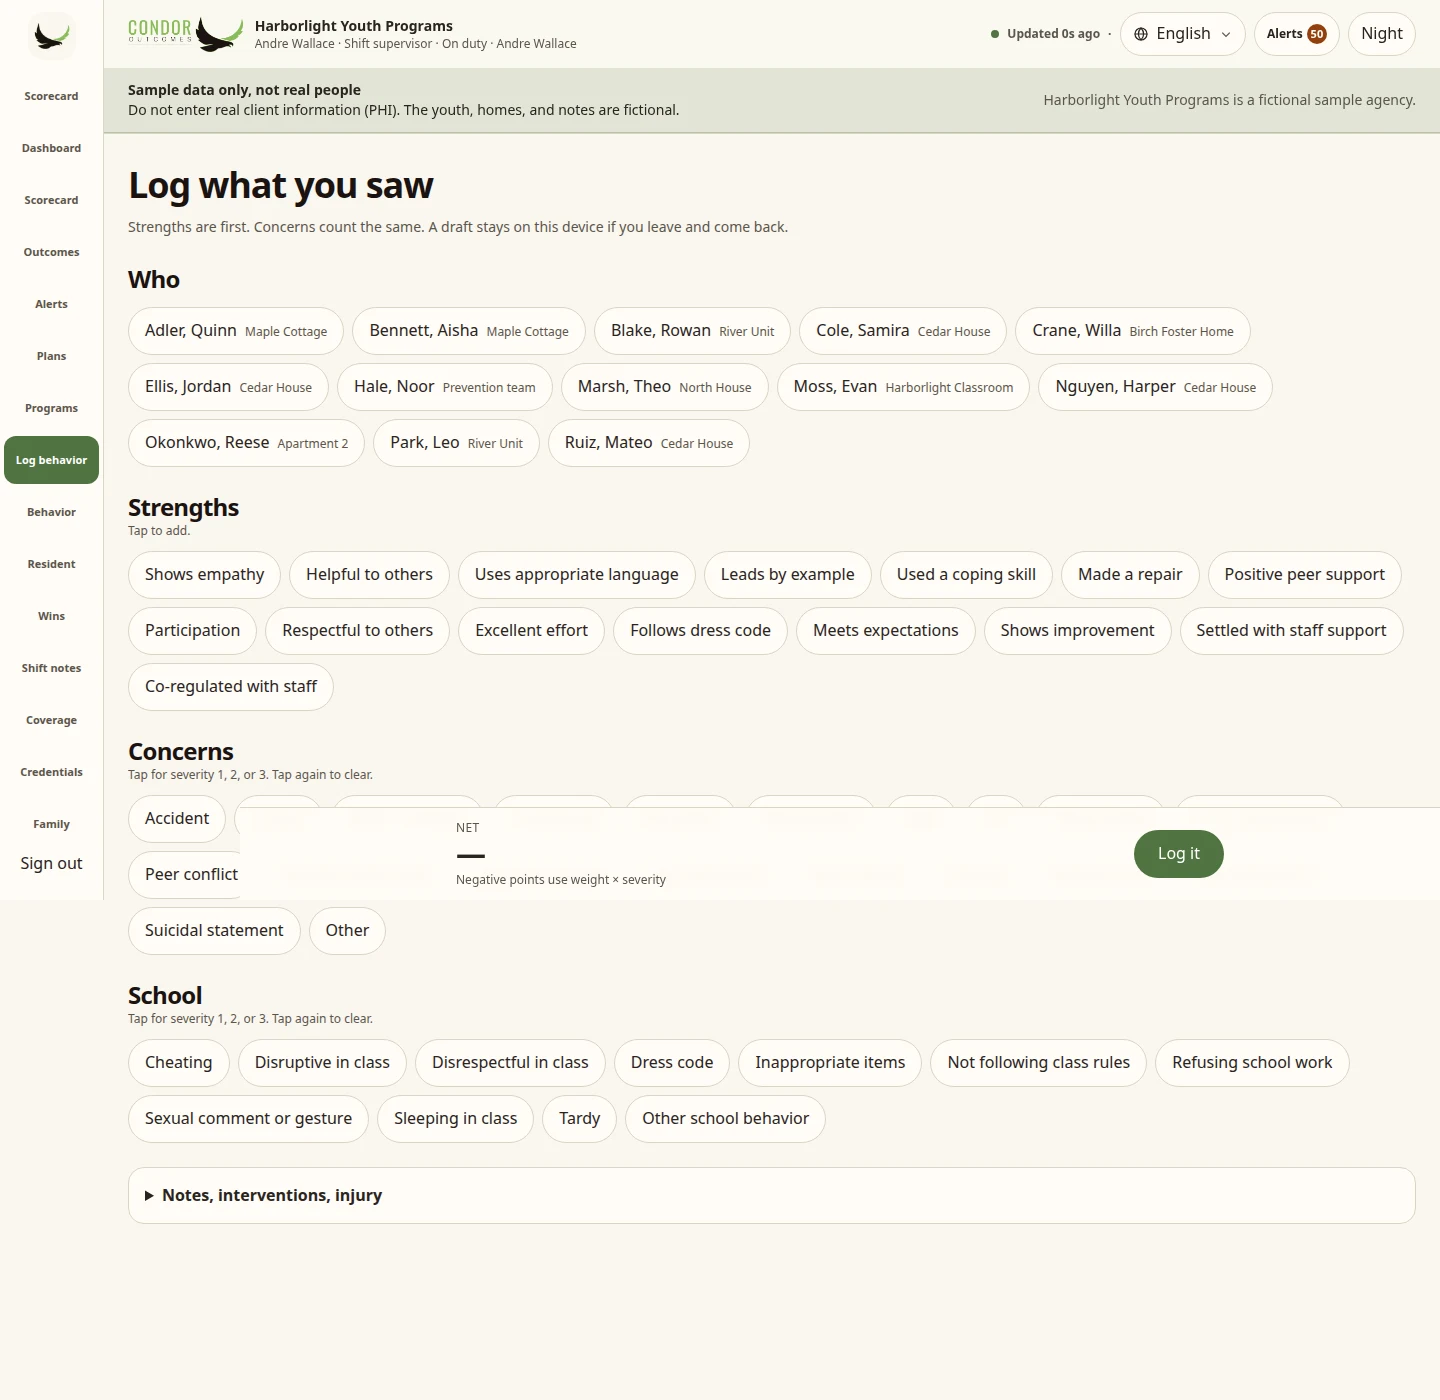
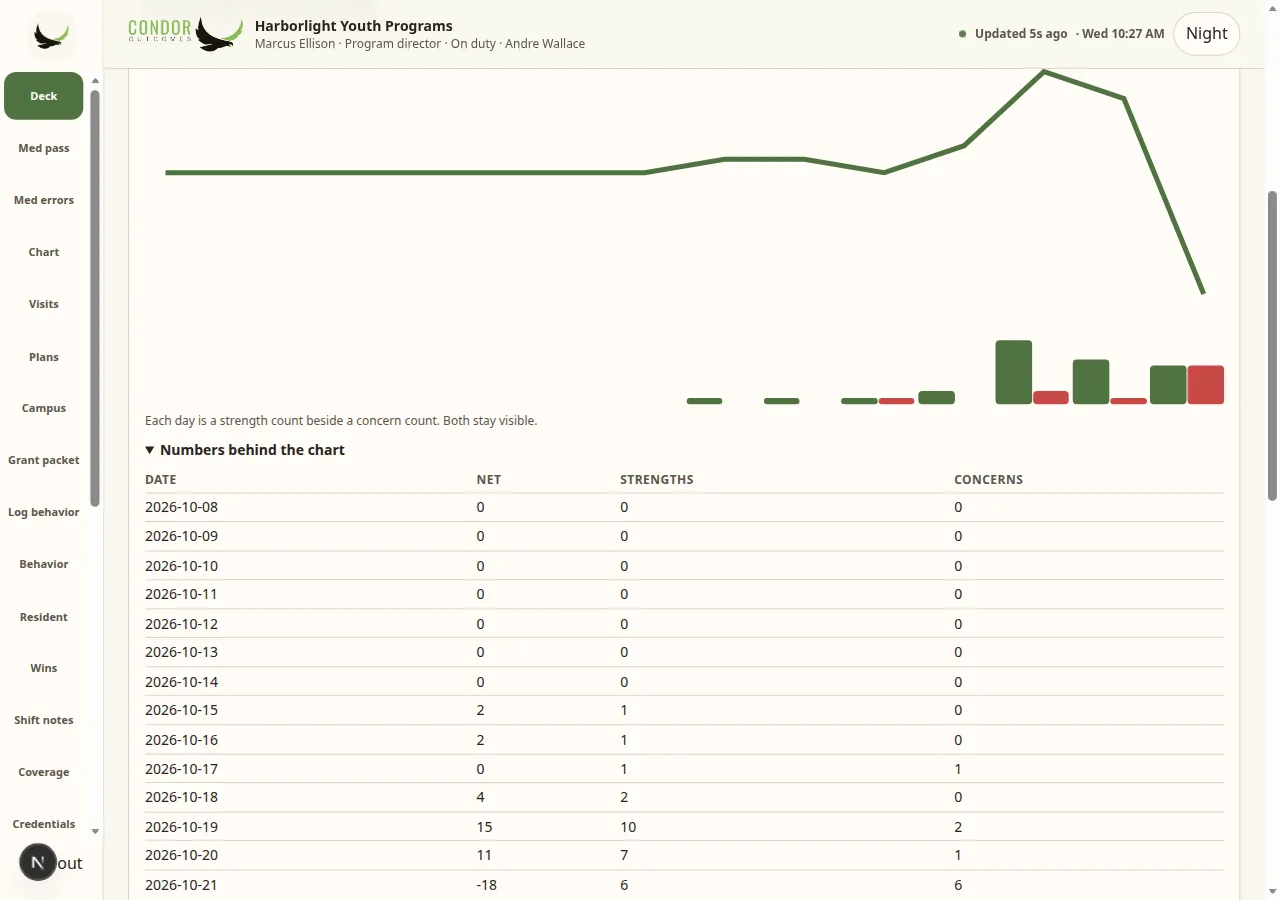
The Scorecard dashboard shows one day: ratings completion, average, wins, incidents, restraints, goals and outcomes. Every number opens the people behind it. Filter by date, unit, program and shift, and save the view for later.
- Fourteen-day trend with a 7-day average and the prior 14 days
- Behaviors by kind: strength, concern and safety, labeled in words
- At risk over time
- Ratings completion by shift
- Saved views
A resident list with trends, streaks and goals
The problem
Before the team meeting, you need to know who is moving and who is stuck.
What Condor does
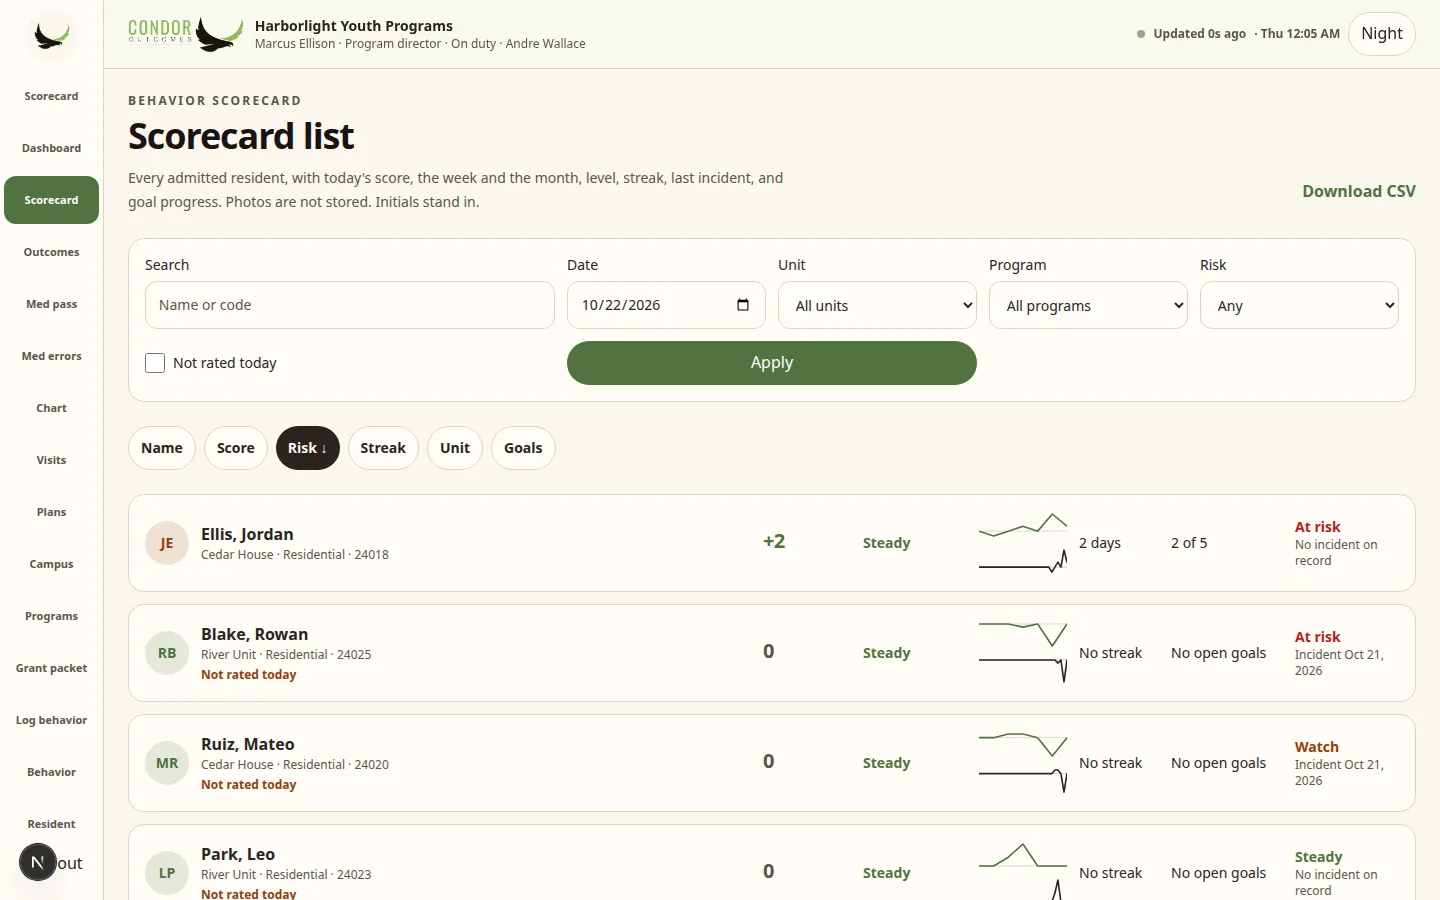
Every admitted person is one row: today’s score, level, week, month, streak, last incident and goals. The list says up, down or flat in words next to the arrow. Search, sort and filter by risk or by who has not been rated.
- Week versus prior, in words
- Sort, search and risk filters
- Not rated today filter
- CSV export, with no photos stored
Thirty days for one person
The problem
A single bad day can hide a good month, or the other way around.
What Condor does
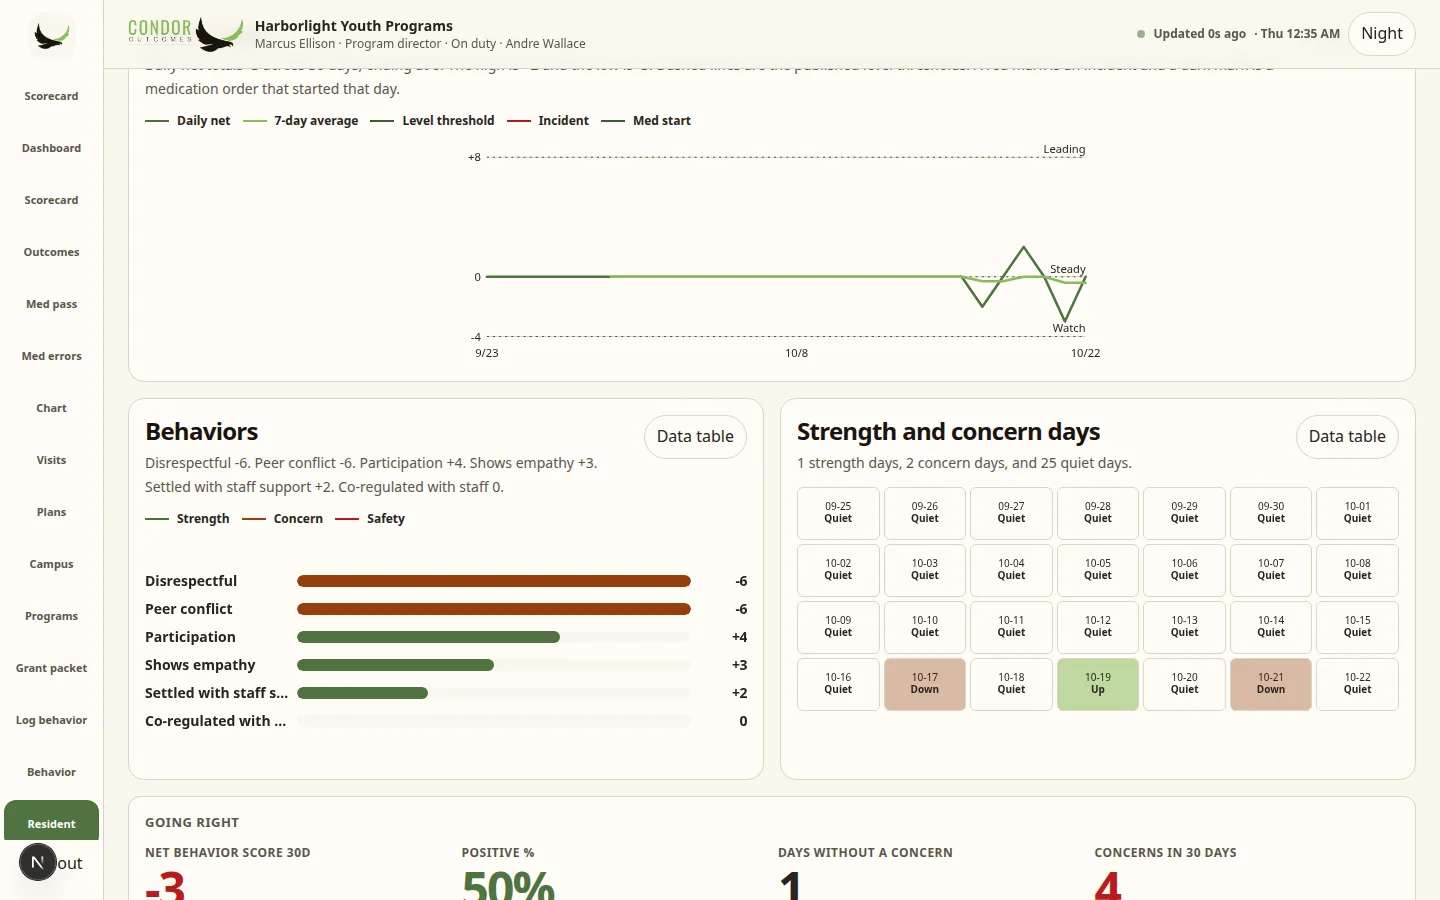
Each profile has a 30-day line with the daily net, a 7-day average, level bands, and marks for incidents and medication starts. Behavior bars show what moved the score most, and a calendar marks each day Up, Down or Quiet in words.
- Resident 30-day line
- Behavior bars with points
- Strength and concern calendar
Every unit and program at a glance
The problem
You cannot compare cottages when each one keeps its own sheet.
What Condor does
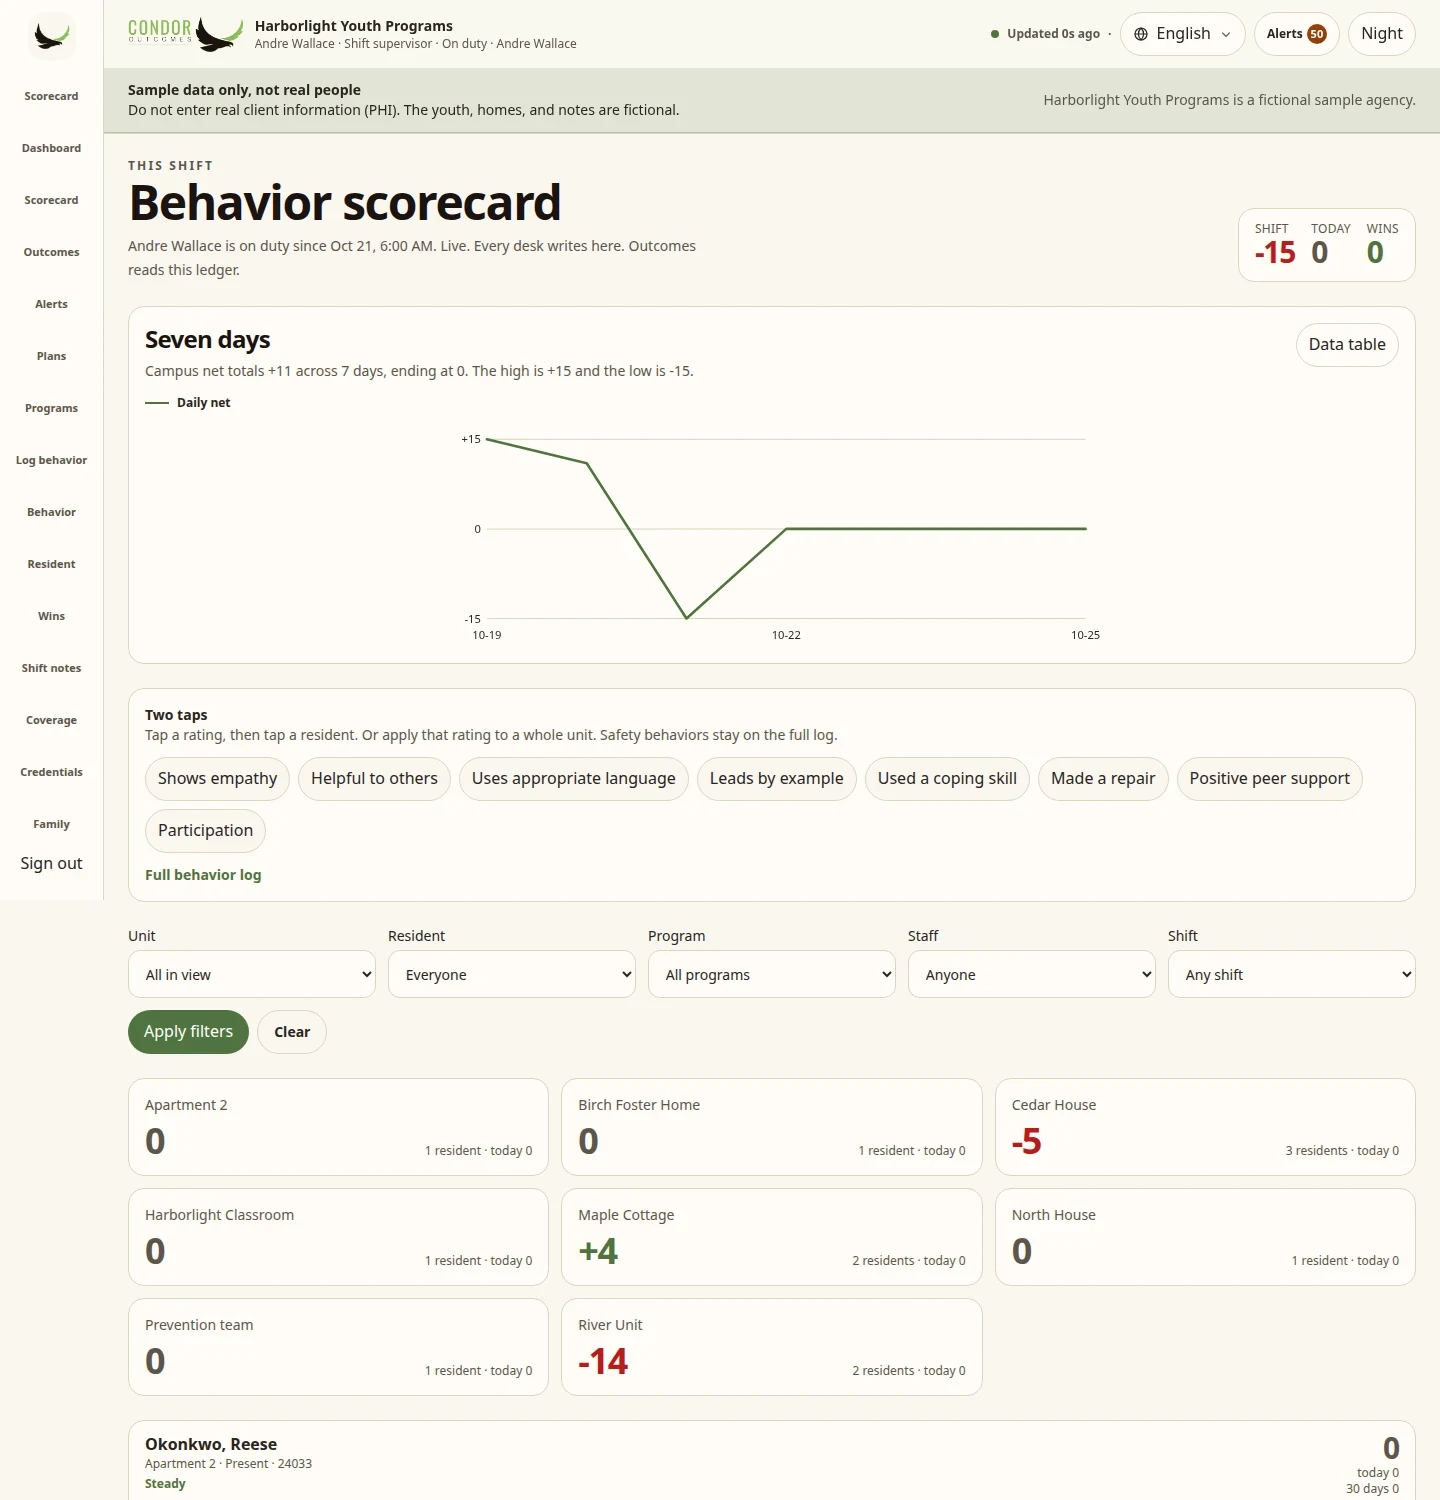
The scorecard home shows the campus’s last seven days with the numbers in a table. Small line charts show each unit’s and each program’s 14-day net side by side.
- Seven-day campus line
- Fourteen days by unit
- Fourteen days by program
Print it or export it
The problem
Not everyone at the table has a login.
What Condor does
Print today’s board with the seven-day line, or download the board as a spreadsheet.
- Printable scorecard
- Scorecard CSV
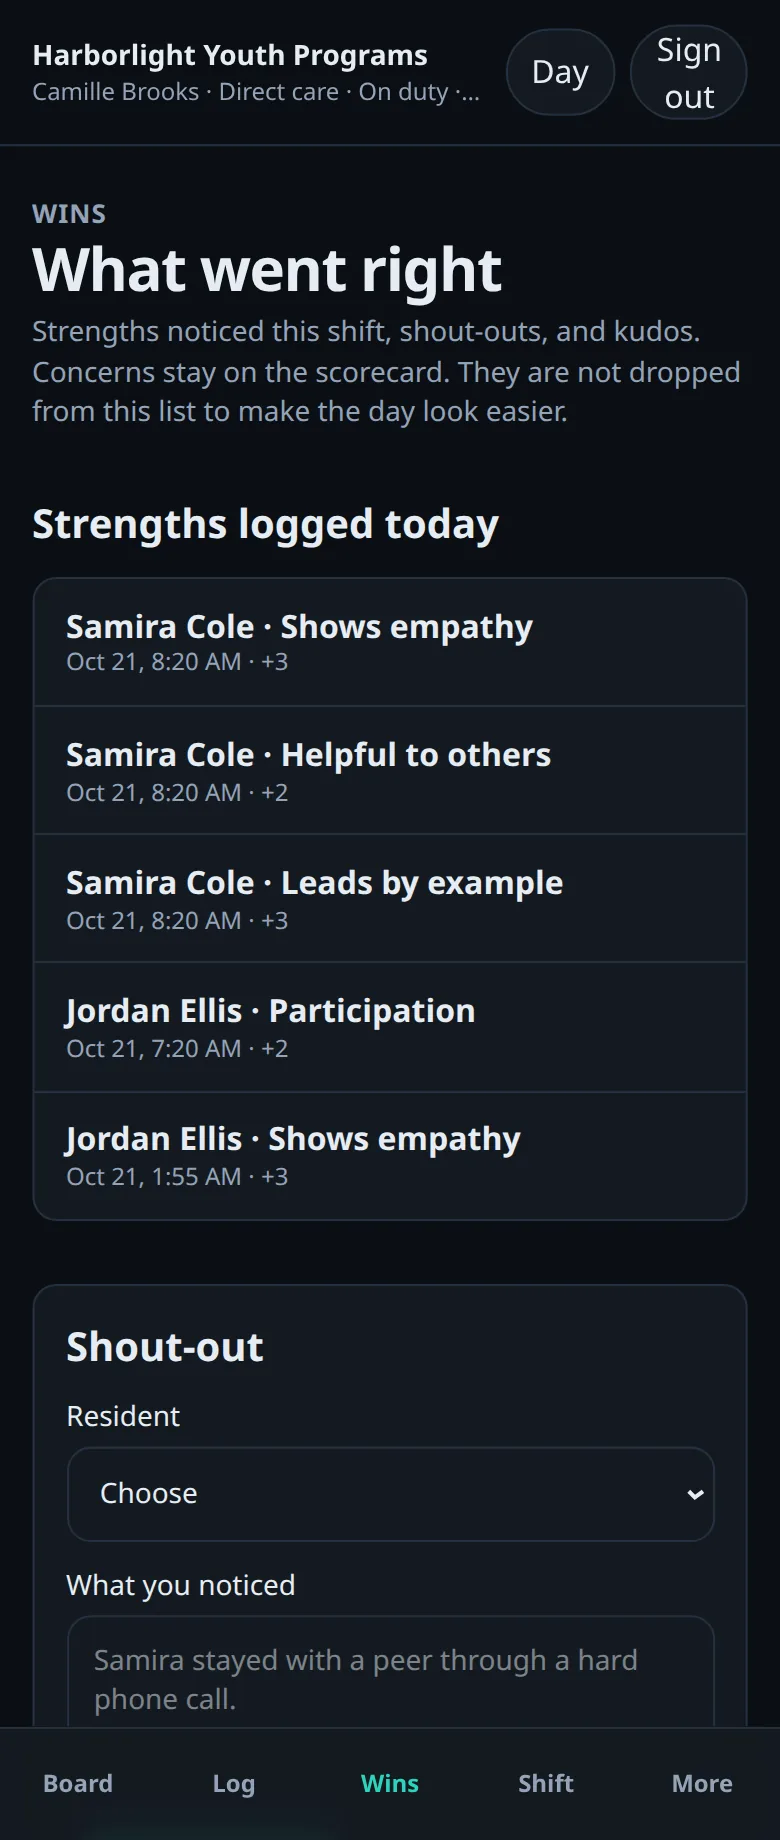
Celebrate wins and streaks
The problem
Kids hear about what went wrong. The good days rarely get seen.
What Condor does
Wins and streaks stay front and center, and strengths are the first thing the next shift reads.
- What went right, today
- Strength streaks
It all comes back to the Scorecard
Every log, note, program and report in Condor feeds the Behavior Scorecard, and the Scorecard feeds Outcomes. One record, one picture of how each person is doing.
ScorecardOutcomesProgramsFeaturesFloorIncidentsMedsCensusLanguagesFamilySharingReportsRolesInteroperabilitySecurity
Integrations · Works with your system
Keep your EHR. Add Condor next to it.
Condor runs alongside the system you already use. No rip-and-replace. No data migration. Most programs can start with a file export in days. Condor connects through FHIR or file export where your system provides it, and the connection wizard walks you through it yourself.
Tested against the public Epic, Oracle Cerner and athenahealth sandboxes and generic FHIR servers. A production connection is set up per agency, with your EHR.
Upload a spreadsheet export. Condor maps the columns for you and shows a preview before anything is saved.
Your system drops a file on a schedule. Condor syncs it on its own, shows health status, and retries if a run fails.
Import admit, discharge and transfer messages as files. This is file-based; there is no live HL7 interface listener.
Pick a format, test it on sample rows, review matches, and turn it on. No ticket to file.
Other systems can read from Condor through a standard FHIR R4 API.
1. Scorecard first. Start with behavior tracking and the outcomes Scorecard. Your EHR stays the system of record.
2. Add MAR when ready. Turn on Condor’s eMAR for a house or a whole agency.
3. Add e-prescribing. E-prescribing through DrFirst is approved and coming soon.
Plain truth: Condor uses standard formats. It does not claim certified, official or real-time connections with any named EHR vendor. Systems such as Netsmart, Credible, Therap or PointClickCare can connect via FHIR or file export where your system provides it. How connections work →
See it with your own program in mind
Try the demo: a made-up agency with sample data only, so never enter real client information. Or start a 14-day free trial with your own empty workspace.
Trial terms: no card, sign up yourself. After 14 days you get 3 days of grace, then read-only with your data kept.
Scorecard is $299/mo billed annually. Scorecard + MAR is $449/mo billed annually ($549 month to month). e-Prescribing add-on $79 per prescriber per month, coming soon. 14-day free trial, no card. White-label and partner options available, contact us. See pricing.